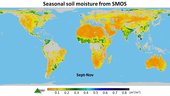
Five years of SMOS data were used to show how moisture in the soil changes with the seasons around the world. The animation illustrates how change according to season is pronounced in higher latitudes, but monsoon dynamics in the Indian subcontinent are also clearly visible. The ‘Sahel transition’ region in Africa is also well depicted. Seasonal flooding in regions such as La Plata in Argentina and the Orinoco Basin in Veneuzela can also be seen.
Launched in November 2009, SMOS carries a novel radiometer to capture images of brightness temperature, which correspond to radiation emitted from Earth’s surface to produce maps of soil moisture and ocean salinity.