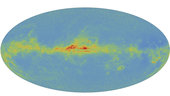
This map is a preview of Gaia’s measurements of the sky in colour.
The image includes preliminary data from 18.6 million bright stars observed by Gaia between July 2014 and May 2016, and it shows the middle value of the colours of all stars that are observed in each pixel. The colour of each star is estimated by comparing the total amount of blue and red light recorded by Gaia.
The Galactic Plane, corresponding to the most densely populated region of our Milky Way galaxy, stands out as the roughly horizontal feature across the image. The reddest regions in the map, mainly found near the Galactic Centre, correspond to dark areas in the density of stars: these are clouds of dust that obscure part of the starlight, especially at blue wavelengths, making it appear redder. It is also possible to see the two Magellanic Clouds – small satellite galaxies of our Milky Way – in the lower part of the map.
Gaia’s first full-colour all-sky map, based on data for more than 1 billion stars, will be unleashed in its highest resolution in April 2018.
Full story: Sneak peek of Gaia’s sky in colour