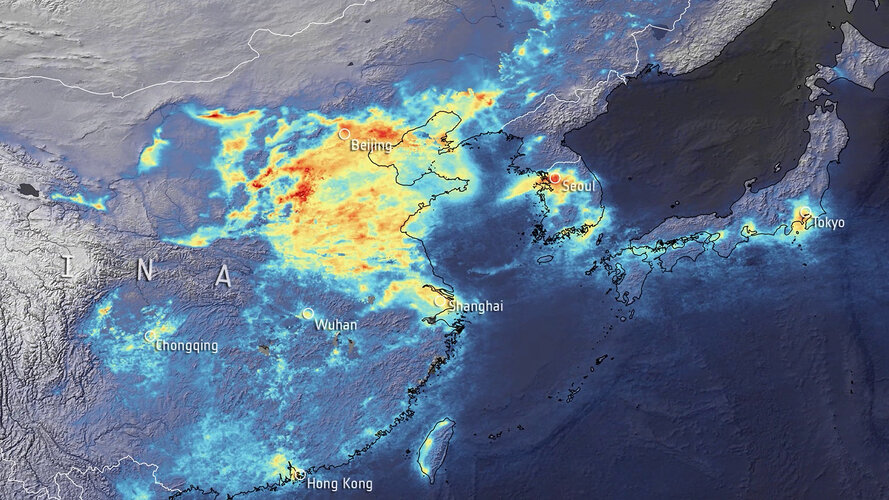
This animation, using data from the Copernicus Sentinel-5P satellite, shows the nitrogen dioxide emissions from 20 December 2019 until 16 March 2020 – using a 10-day moving average. The drop in emissions in late-January is visible, coinciding with the nationwide quarantine, and from the beginning of March, the nitrogen dioxide levels have begun to increase.
Click here for original story, Nitrogen dioxide emissions over China
Source: ESA Top Multimedia