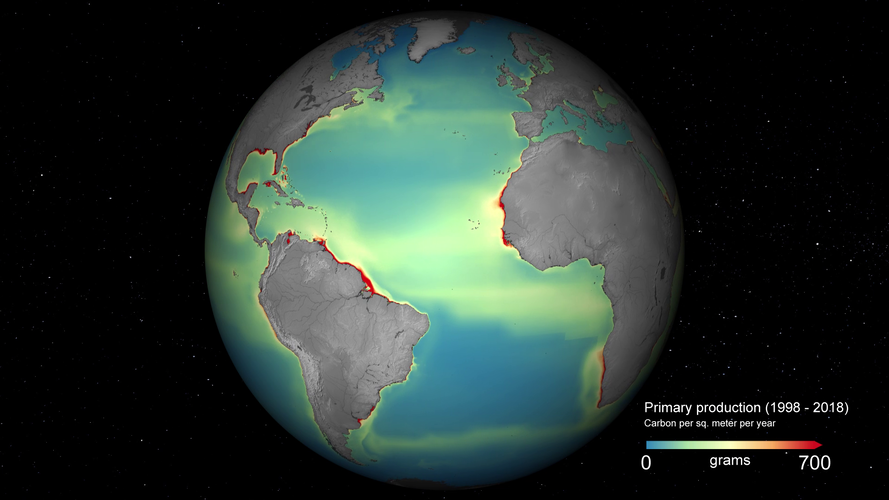
This map shows the global annual primary productivity from 1998-2018. In a recent paper published in Remote Sensing, scientists used data from the Ocean Colour Climate Change Initiative to study the long-term patterns of primary production and its interannual variability.
Click here for original story, Global annual primary production
Source: ESA Top Multimedia